I’ve been collecting data on state legislative endorsements of the 2020 Democratic presidential candidates. This is one lens to understand how party elites sort out who to support as the leader of their party in the single most important election in the country. Congressional and gubernatorial endorsements are being collected by FiveThirtyEight, and that’s important, too. But state legislators are more diverse, more free to make sincere choices, and there are just so darn many of them to help us analyze them.

There are 3,465 Democratic state representatives and senators. Around 640 or around 18% of them have made an endorsement (up from 10% in October). At the same time, about 48% (up from 33% in October) of the early state (Iowa, New Hampshire, South Carolina, and Nevada) Democrats have made a choice, which makes sense, as the early states are where the campaigns are most furiously operating. For comparison, only 11% of the Super Tuesday (March 3, 2020) residing Democrats have made a choice. Note that I’m only counting endorsements of active candidates so Kamala Harris’ large number of California endorsements are no longer being counted (thus, in October 13% of Democrats had endorsed then-active candidates).

Let’s look at the endorsement race as a whole, which Joe Biden still leads by a substantial margin, which matches his still-strong poll numbers. Notably, Elizabeth Warren who had been in 5th place in October, now is in second place. Bernie Sanders has relatively few endorsements relative to his poll numbers, while Amy Klobuchar has relatively more endorsements relative to hers. Pete Buttigieg has very few in general.

Note also how, with the exception of Klobuchar, the top candidates get zero or near-zero support from home state legislators. Familiarity breed contempt?

Now let’s turn to the four early states, where 178 of 374 possible endorsements of active candidates have been made (48%). Here, I’ve transformed the raw endorsement counts into proportions of in-state Democratic endorsements to account for the very different sizes of numbers of available Democrats across the states. Biden has the lead, but Warren and Klobuchar are doing fairly well. Sanders is further behind, and Buttigieg is nowhere.

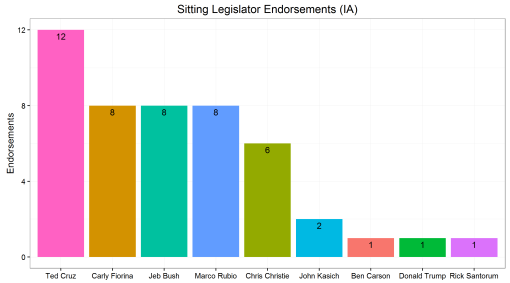
Alternatively we can plot out the early states. Here, we see that the vast majority of Iowa’s Democrats have already made a choice, and it is disproportionally for Klobuchar. New Hampshire is an area of strength for Warren, while South Carolina and Nevada are Biden’s strengths.

Finally, we can look at the 14 states holding a primary election on Super Tuesday 2020. We’ve only had 119 endorsements out of the maximum possible of 1,057 (11%). Joe Biden absolutely dominates here, with solid endorsement numbers from 6 states. The other candidates are barely competitive.

I haven’t finished the ideological breakdown of these endorsers, but I hope to do so soon (and will update the post when I do).

I’ve been collecting data on state legislative endorsements of the 2020 Democratic presidential candidates. This is one lens to understand how party elites sort out who to support as the leader of their party in the single most important election in the country. Congressional and gubernatorial endorsements are being collected by FiveThirtyEight, and that’s important, too. But state legislators are more diverse, more free to make sincere choices, and there are just so darn many of them to help us analyze them.

There are 3,465 Democratic state representatives and senators. A little over 10% of them have made an endorsement, which makes sense as the first votes are still months away. At the same time, about 33% of the early state (Iowa, New Hampshire, South Carolina, and Nevada) Democrats have made a choice, which makes sense, as the early states are where the campaigns are most furiously operating. For comparison, only 13% of the Super Tuesday (March 3, 2020) residing Democrats have made a choice.

Let’s look at the endorsement race as a whole, which Joe Biden still leads by a substantial margin, which matches his still-strong poll numbers. Kamala Harris has overtaken Sanders to move into second place. Notably, Elizabeth Warren is far behind in 5th place — with very few endorsements even from Massachusetts Democrats who we might expect to naturally support her. Her low support from Democratic elected officials is very much in contrast to her newly-strong poll numbers and her commanding lead in the prediction markets. Finally, Cory Booker is doing much better in endorsements than we might expect based on polls.

See also the difference between candidates drawing their supporters in a substantial way from their home states: Harris (CA), Klobuchar (MN), Castro (TX) and O’Rourke (TX), as opposed to candidates like Biden, Sanders, Booker, Warren, and Buttigieg, who’ve compiled the vast majority of their endorsements outside their home state.

Now let’s turn to the four early states, where 125 of 374 possible endorsements have been made (33%). Here, I’ve transformed the raw endorsement counts into proportions of in-state Democratic endorsements to account for the very different sizes of numbers of available Democrats across the states. The picture looks very similar to the one above. Biden has a substantial lead (powered in large part by getting very large numbers of SC and NV endorsements), and Warren is very far behind in 5th place.

Finally, we can look at the 14 states holding a primary election on Super Tuesday 2020. We’ve only had 137 endorsements out of the maximum possible of 1,057 (13%). Unlike in the other plots, Kamala Harris enjoys a big lead, powered by California where she’s really taken a massive haul of endorsements in her home state. Biden isn’t doing as well, though oddly he’s dominating the all-important Utah Democratic delegation.

Finally, let’s look at the ideological breakdown of the legislators endorsing the top 5 candidates in the polls. Obviously the endorsement decision isn’t purely ideological. But this far out from the primaries, it’s likely to be more sincere because closer to the voting strategic considerations are more likely to come into play (eg better to bandwagon with a winner).

The data is taken from my state legislator ideology data (updated). I’ve subsetted only the in-office, and out-of-state endorsements to eliminate the home-state influence (to isolate the effect of ideology).

The average ideology of the candidates’ endorsers has a few non-surprises and a few surprises. Biden is unsurprisingly endorsed by the most moderate Democrats. Warren is endorsed by the most liberal Democrats, surprisingly substantially more so than Sanders. Buttigieg and Harris are in the middle. I guess I’m surprised that Buttigieg’s endorsers aren’t more moderate, and Harris’ more liberal.

Another thing. Warren is getting her endorsements centered at the most liberal 25% of the Dems. There’s plenty of Dems there, but there’s a lot more where Sanders, Buttigieg, and Harris are in the Dem center. Even Biden is fishing in a more populated area (most moderate 40% of D).

NB: This post has been updated on 10/18/2019 to focus only on non-retired state legislators, and to update for new endorsements in the past week.

I recently had a nice conversation with Nathan Heffel for Colorado Matters at Colorado Public Radio. I revisited my data to confirm that Colorado is now the most polarized state legislature in the country, passing California in the past two years.

avg_polarization_2016

The plot below shows the trend over the past two to three decades, and it underlines the speed with which Colorado has polarized — the fastest in the country.

polarization_years_speed

Breaking down the trend in polarization by party and chamber, it looks like the Republicans in both chambers and Democrats in the House have been largely responsible for this trend. Senate Democrats are fairly liberal but haven’t change much in the past few years.

co_party_chamber_years


I have a new blog post up at the Monkey Cage on the Iowa caucuses. Unlike in Congress where only a single Republican has made an endorsement, the majority of Republicans in the state legislature (47 of 82) have decide to endorse a candidate. That candidate is Ted Cruz. Only a single state legislator has endorsed Donald Trump.

ia_endorse.png

When you include retirees, the picture changes significantly. Now, Jeb Bush is in the lead. The question is whether retired state legislators have the pull of sitting ones.

ia_endorse_all.png

We’ve just released the July 2014 update of our state legislative ideology data set. Both legislator-level and state-level data are included, so you can use these scores for a number of different applications.

Big changes include:

  1. Expansion of the quantity of the data by 25% at the state level, and 11% at the individual level.
  2. Expansion of the breadth of the data to include 1993-2013.
  3. Filling in holes of the coverage even before 2012.
  4. Extensive cleaning and merging operations to minimize the effect of random noise.

Head over to the data site to check it out!


A fascinating series of votes just concluded in Arkansas’ state legislature. A year ago, Medicaid expansion was enacted in the state. What is remarkable is that not only is it one of the  more conservative states in the US, both chambers of the legislatures are controlled by Republicans, and the vote that required a 3/4 supermajority. Those are serious obstacles to Medicaid expansion at a time when the Affordable Care Act is fairly unpopular, especially with conservative Republicans.

The key to overcoming these hurdles was the decision by Democratic Governor Mike Beebe to seek Medicaid expansion by placing new enrollees onto the private health care excange rather than simply expanding traditional Medicaid rolls in the state. This experiment was ratified by Obama administration, despite misgivings. With this deal in hand, Beebe was successful in obtaining approval from the Republican legislature.

The appropriations bill containing the private option is up for reauthorization every year. Given how unpopular the ACA and Medicaid expansion are with conservatives, you’d expect the vote to go down resoundingly. Especially if the supermajority threshold was set at 75% of both legislative chambers. Instead, after a few tough votes in the state House (where the measure passed but just below the 75 vote threshold) and a single one in the state Senate, the measure passed, and is on its way to being signed by Beebe.

So, with a majority of Republicans joining all Democrats in voting for the measure across both chambers, party is not a very good guide for helping us know why people voted as they did. Instead, I argue ideological considerations would be central, and that the Republican divide would largely be one of (relative) moderates and (relative) conservatives.

I estimated a simple bivariate model of the final passage votes, with our state legislative ideological scores as the sole predictor. Below is a visualization of the predicted probabilities coming out of the model (the blue line), with actual votes as dots at 1 (Yes) and 0 (No), colored by party (Democrats blue, Republicans red). The blue crosses 50% at around a score of 1.75 or so; so those more liberal than that score are roughly predicted to vote No, and those above Yes.

ar_medicaidvote_030414

The model does quite well, correctly predicting approximately 83.4% of the votes, much better than a model that looked solely at party. So most of the vote could be explained by the ideology of the state legislators voting. That’s perhaps not surprising, considering how ideologically-charged health care policy is in the United States.

It does get a number of the Republican votes wrong (those No votes who are between about 1 and 1.75 on the ideological scale, and a few Yes votes who are above 1.75). So ideological considerations are not the sole determinant of this vote, nor of all votes. But they’re likely the biggest.

I am currently writing an academic paper on the votes in the states on Medicaid expansion and establishing state-based health insurance exchanges (here’s a very old and rough version). What I find is that Republicans are deeply divided over both policies in the states wherever these votes have occurred, despite the unanimity of Republican opposition in Congress to the ACA. And that division is largely explained by the ideological stances of legislators: current Republican moderates and moderate conservatives vote in favor of these policies, while hard core conservatives vote against. Lots of fascinating things are happening in health care policy at the state level, so paying attention only Washington, DC is deeply misleading.

The fascinating thing about this vote is that it underlines how typically progressive policies like ACA expansion can take root even in such inhospitable soil. The Arkansas example and continued flexibility by the Obama Administration’s HHS Department can presage future expansion in the 25 remaining states that have not yet done so. And it looks like other Republican-dominated states like Pennsylvania, New HampshireMissouri, South DakotaUtah, and others are directly emulating Arkansas’ example.


I have a new post over at the Monkey Cage blog at the Washington Post. It summarizes some of the posts I’ve made here, for an audience that probably hasn’t seen this blog before.

The one update is that the posts here used the most recent publicly available version of our aggregate state legislative data. That data includes the years up through 2011. The Monkey Cage post uses a preliminary update to our data set, that brings the data to 2013.

We are working on polishing this data for public release shortly.

In the meantime, here are the new plots using that data set. The graph below shows legislative polarization in each state, averaging across all the years of our data (approximately 1996-2013) and across both legislative chambers. Polarization is defined as the average ideological distance between the median Democrat and Republican in the state legislature.  Larger numbers indicate more division. The dashed line is the level of congressional polarization, included as a comparison (“US”).

state_polarization

About half of the states are even more polarized than Congress—which is saying a lot. At the same time, some states–like Louisiana, Delaware, and Rhode Island–have  relatively less polarized state legislatures. In Louisiana, both parties are fairly conservative, and in Delaware and Rhode Island, they are both fairly liberal.

One state that stands out is California. It is incredibly polarized. (And its most recent primary and redistricting reforms look unlikely to reduce polarization.) Unlike Congress, however, Democrats both dominate the state so thoroughly and no longer need to attain supermajorities to pass budgets, so this polarization is not as much of an obstacle to actual lawmaking in the California state legislature.

Another state that stands out is Wisconsin–the site of massive protests in 2011, a recall campaign against sitting governor Scott Walker, and even a physical fight between Republican and Democratic justices on its state Supreme Court.  It is perhaps no surprise that Wisconsin too is highly polarized.

Not only are states polarized, that polarization has increased over time. The graph below breaks down the trends in the ideology of Democrats and Republicans (measured by party medians) over time and across all 50 states. By convention, more positive scores represent more conservative preferences, and more negative scores represent liberal preferences. (One side-note: a data error exists in Washington State around the year 2000 and is being fixed.)

party_years

Most states have polarized over the past 20 years or so, but some more than others. Arizona, California, and Colorado are polarizing very fast. Nebraska—a state without formal political parties in its legislature—is polarizing very quickly too, though from a relatively low base.

Moreover, we are seeing asymmetric polarization, just as in Congress. Republicans have been getting more extreme faster than Democrats in more state legislative chambers, but this is by no means universally true across all states.

All in all, the picture we see in state legislatures is similar in many respects to Congress, but different in key points. The parties are pretty far apart on average, but that difference varies across the states. The parties are increasingly polarizing over time, but that too varies across state. Finally, we see cases of symmetric and asymmetric polarization. These new data on polarization at the state level—and the uneven pace of polarization across states—should help pundits and scholars figure out what’s driving polarization in our statehouses.

Over at American Legislatures, I show that, on the whole, polarization is asymmetric in the state legislatures. Republicans are polarizing faster across more states than Democrats. Examples include Tennessee and Colorado. But in lots of states, the patterns are different, where Democrats are leading the charge to extremism (eg, Idaho, Mississippi, and California). And both parties are polarizing roughly equally and simultaneously in places like Texas, Missouri, and Nebraska.

Read the whole post but here’s the key plot:

party_chamber_years

I have a new post about polarization trends in state legislative chambers across the country in the sister blog. Go there for the full details.

Here’s a little peek at the key plot.

polarization_chamber_years

Most state legislative chambers are polarizing, but a number are stable and a few are even going the other way.

Over at American Legislatures, I have a new post about Governor Chris Cristie’s choices for a replacement nomination for US Senate in New Jersey. Three of the top choices from the state legislature–Tom Keane, Joe Kyrillos, and Jon Bramnick–are current state legislators who are near the center of their party in the state (with Bramnick slightly more to the left).

The punchline, though, is that New Jersey Republicans are amongst the most moderate in the country:

npat_boxplot_states_parties_nj

I estimate that they would probably vote like Maine Senators Olympia Snowe and Susan Collins once in Congress.